What is Audit Trail?
An audit trail in the context of a generalized artificial intelligence (Gen AI) platform refers to a chronological record of activities or events performed within the platform. It serves as a comprehensive and transparent history of actions taken in the platform, enabling accountability, traceability, and the ability to review and understand the sequence of events.
Key components of an audit trail in a Katonic AI platform may include:
Information of the new user created - It will contain the email-id of the user logged in into the platform,username, first name , last name, role assigned while creating the user, the different types of deployments like model, app and launcher deployments, user based restrictions we use for chat/search file uploads and max websites and the user id.
Gen-AI Deployments - It will contain the information of the newly created or deleted model, app and launcher deployments. It also contains the information of the prompts created.
Workspace Deployments - It contains the information about the newly created or deleted workspaces.
Errors and warnings - Details of errors and warnings occuring during events. #How to use the Audit Trail?
Click on the Admin section from the sidebar. A column will slide out from the side bar containing different options.
Click on Audit Trail in the column and you will find the Audit Trail appear on the main screen.
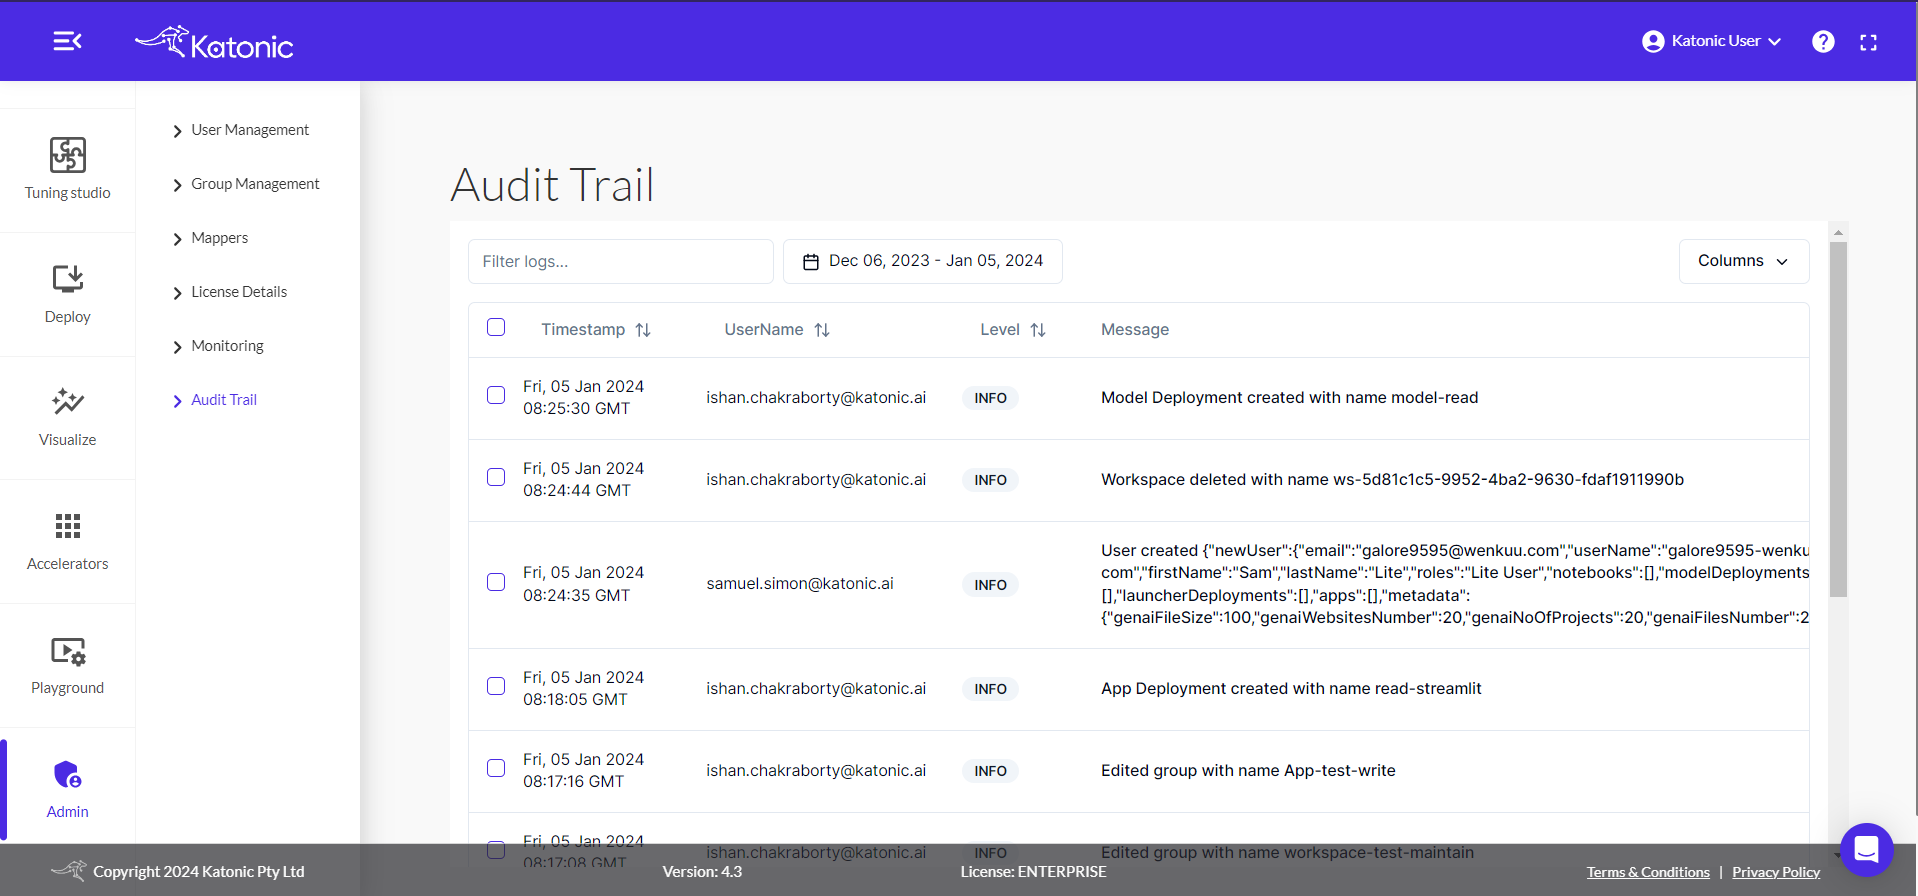
You can refer to the Timestamp column for the time point at which an event happened. You can click on the up-down arrows beside it to sort the logs from newest to oldest or vice-versa. By default, the timestamps will be sorted from newest to oldest events.
You can refer to the UserName column for the usename id from which the activity or event took place. You can click on the up-down arrows for sorting the usernames alphabetically and the logs will get sorted accordingly. By default, the logs will be sorted from newest to oldest irrespective of the alphabetical order.
You can refer to the Level column to filter according to the desired level category. You can click on the up-down arrow to open a drop down list of level categories. The categories include: ALL, INFO, DEBUG, ERROR, WARN. You can click on the desired category to see the list of logs.
Definition of categories :
- ALL - Displays all the logs irrespective of any category.
- INFO - Displays the logs that contain the information of newly created and deleted deployments,workspace, prompts,etc.
- DEBUG - Displays the logs that contain information that may be needed for diagnosing issues and troubleshooting or when running application in the test environment for the purpose of making sure everything is running correctly.
- ERROR - Displays the logs that contain information about failed events.
- WARN - Displays the logs that indicate that something unexpected happened in the application, a problem, or a situation that might disturb one of the processes. But that doesn’t mean that the application failed.
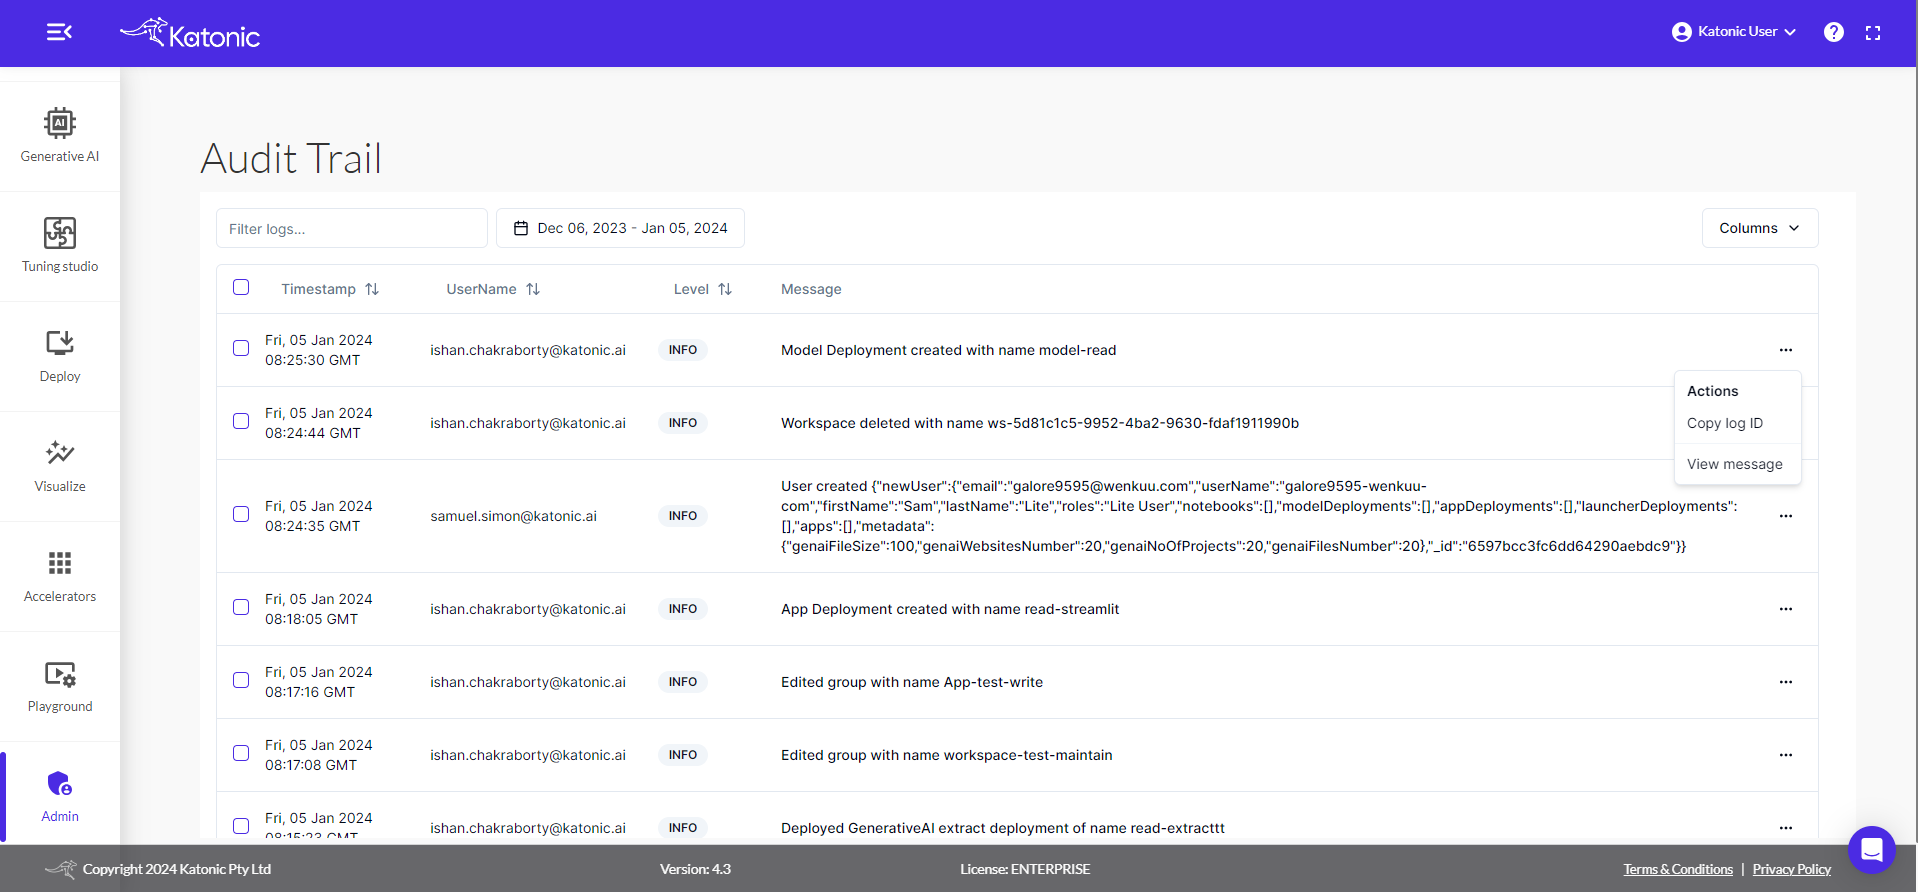
You can refer to the Message column to read the details of the event like the details of the username, details of deployments,etc. You can dig more into the logs by clicking on the three dots beside the log message. After clicking on it, you will see a dropdown, labeled as Actions, with two options: Copy log ID and View message.
Definition of options :
- Copy log ID - Every log will have a identification number that you can copy by clicking on this option.
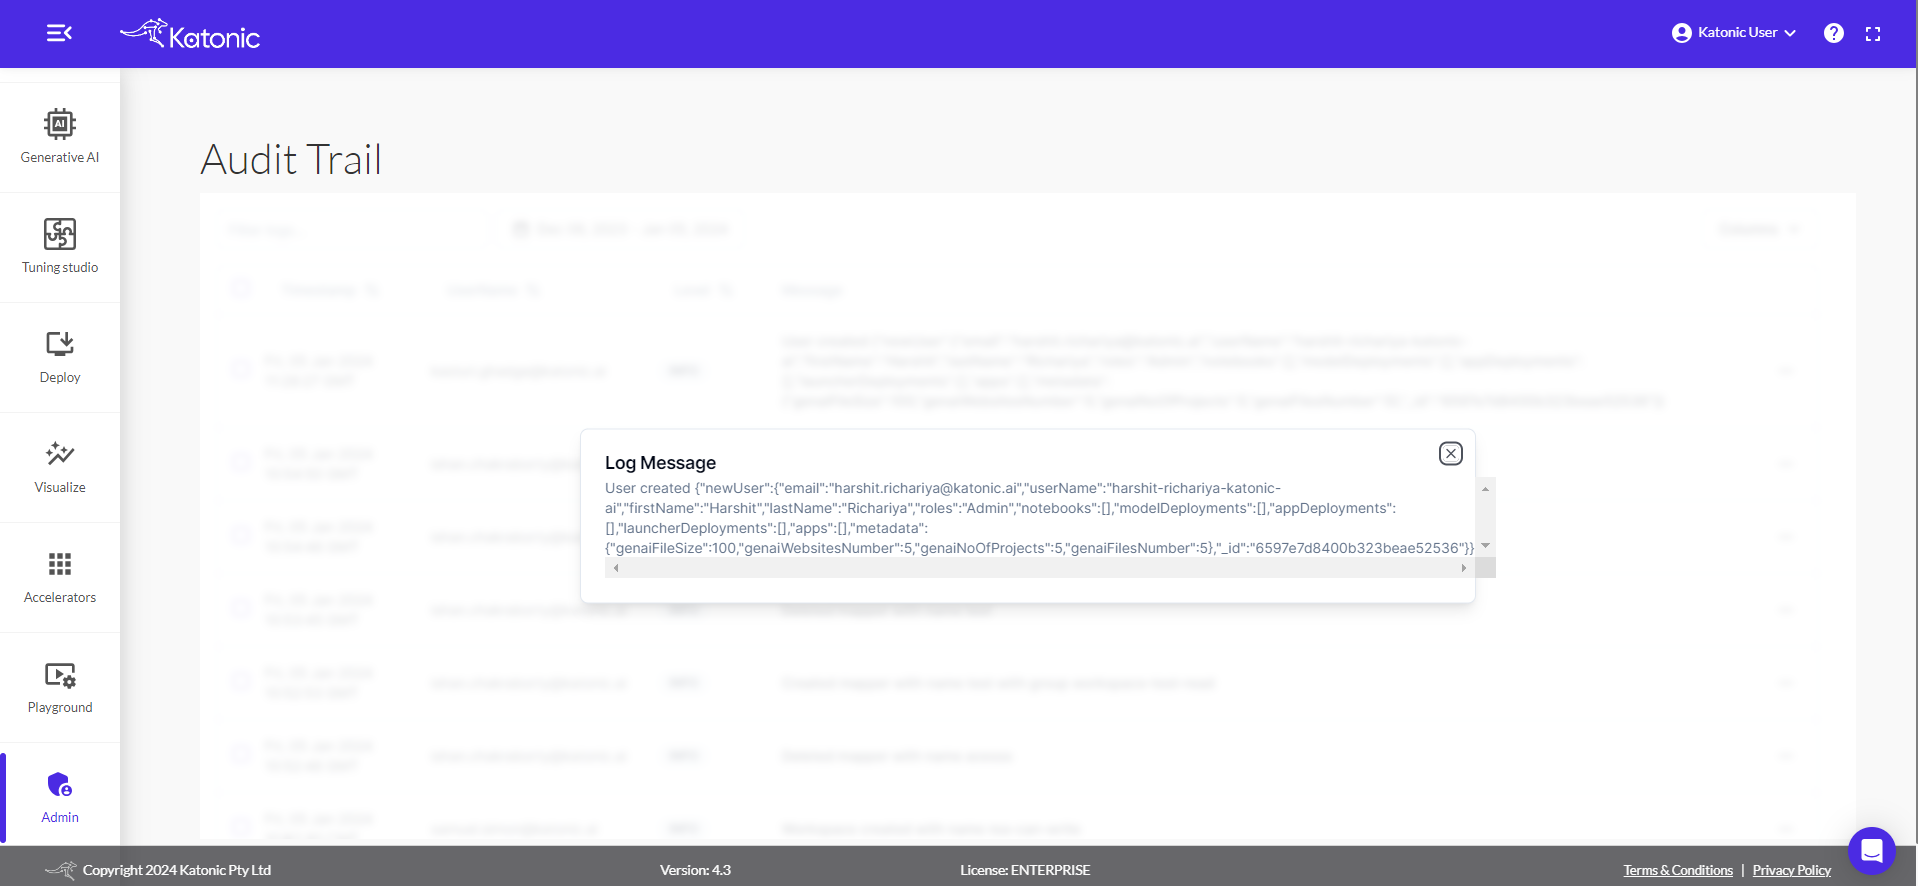
- View message - You can view the log details if it is not seen completely on the main interface.
On the top of the logs table, you can find the Filter logs.. field, where you can filter the logs by username or log message bits.
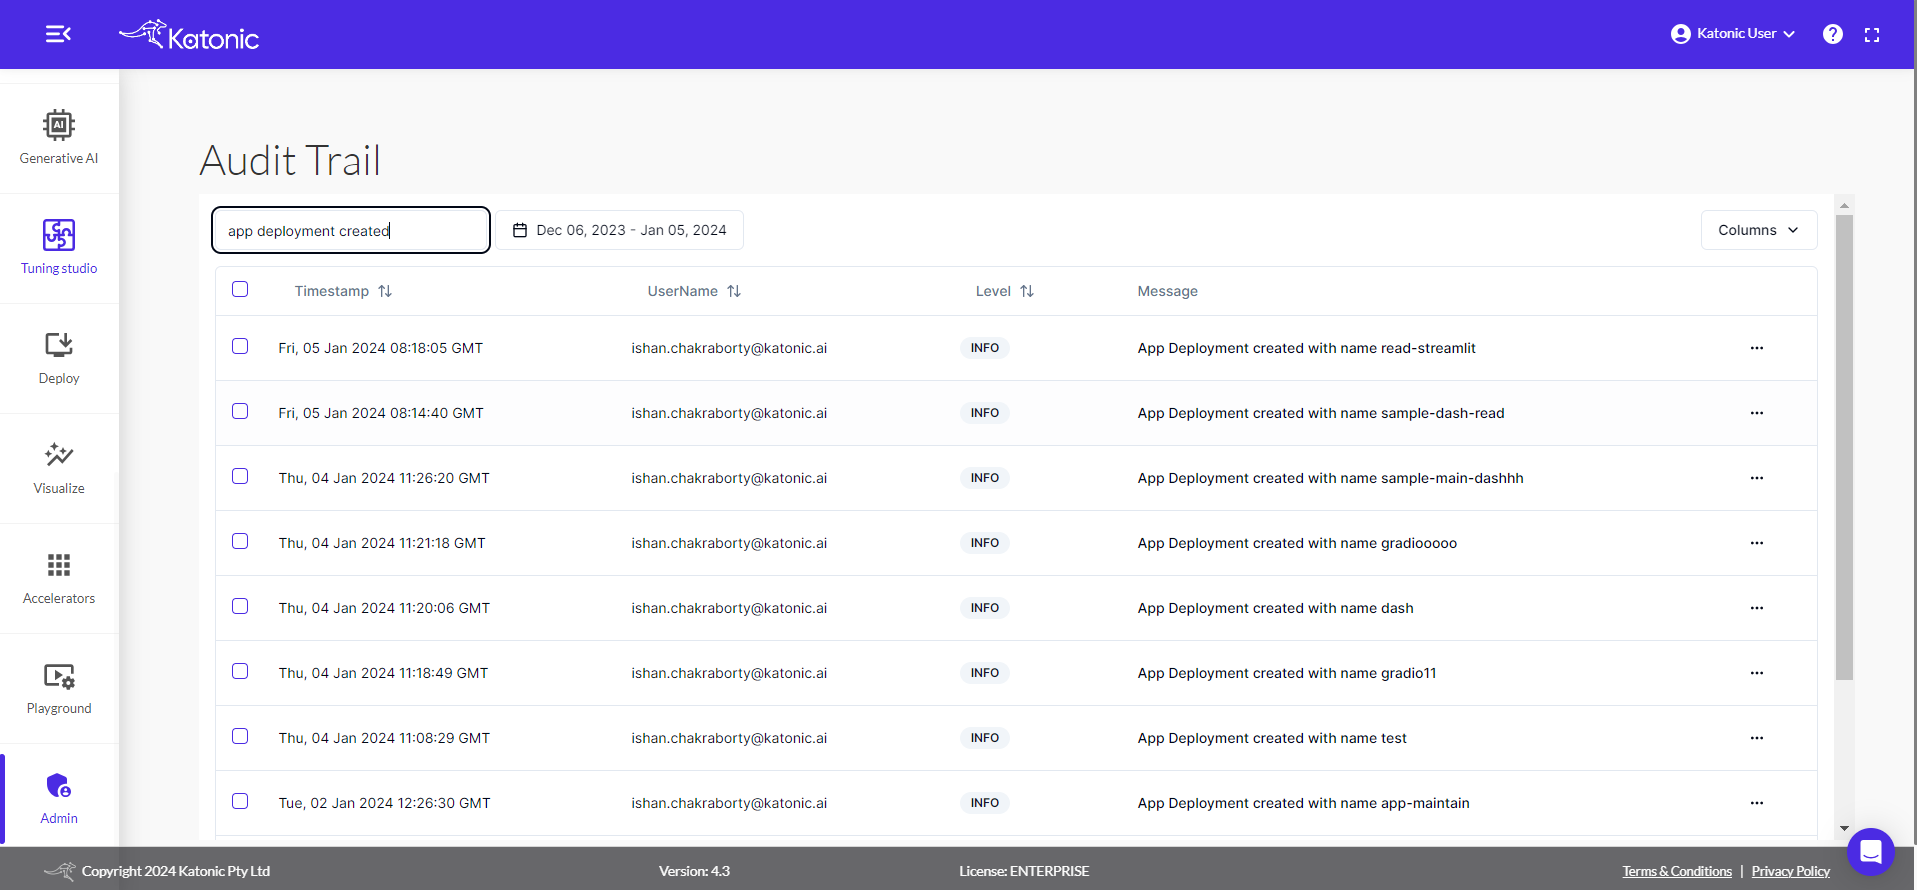
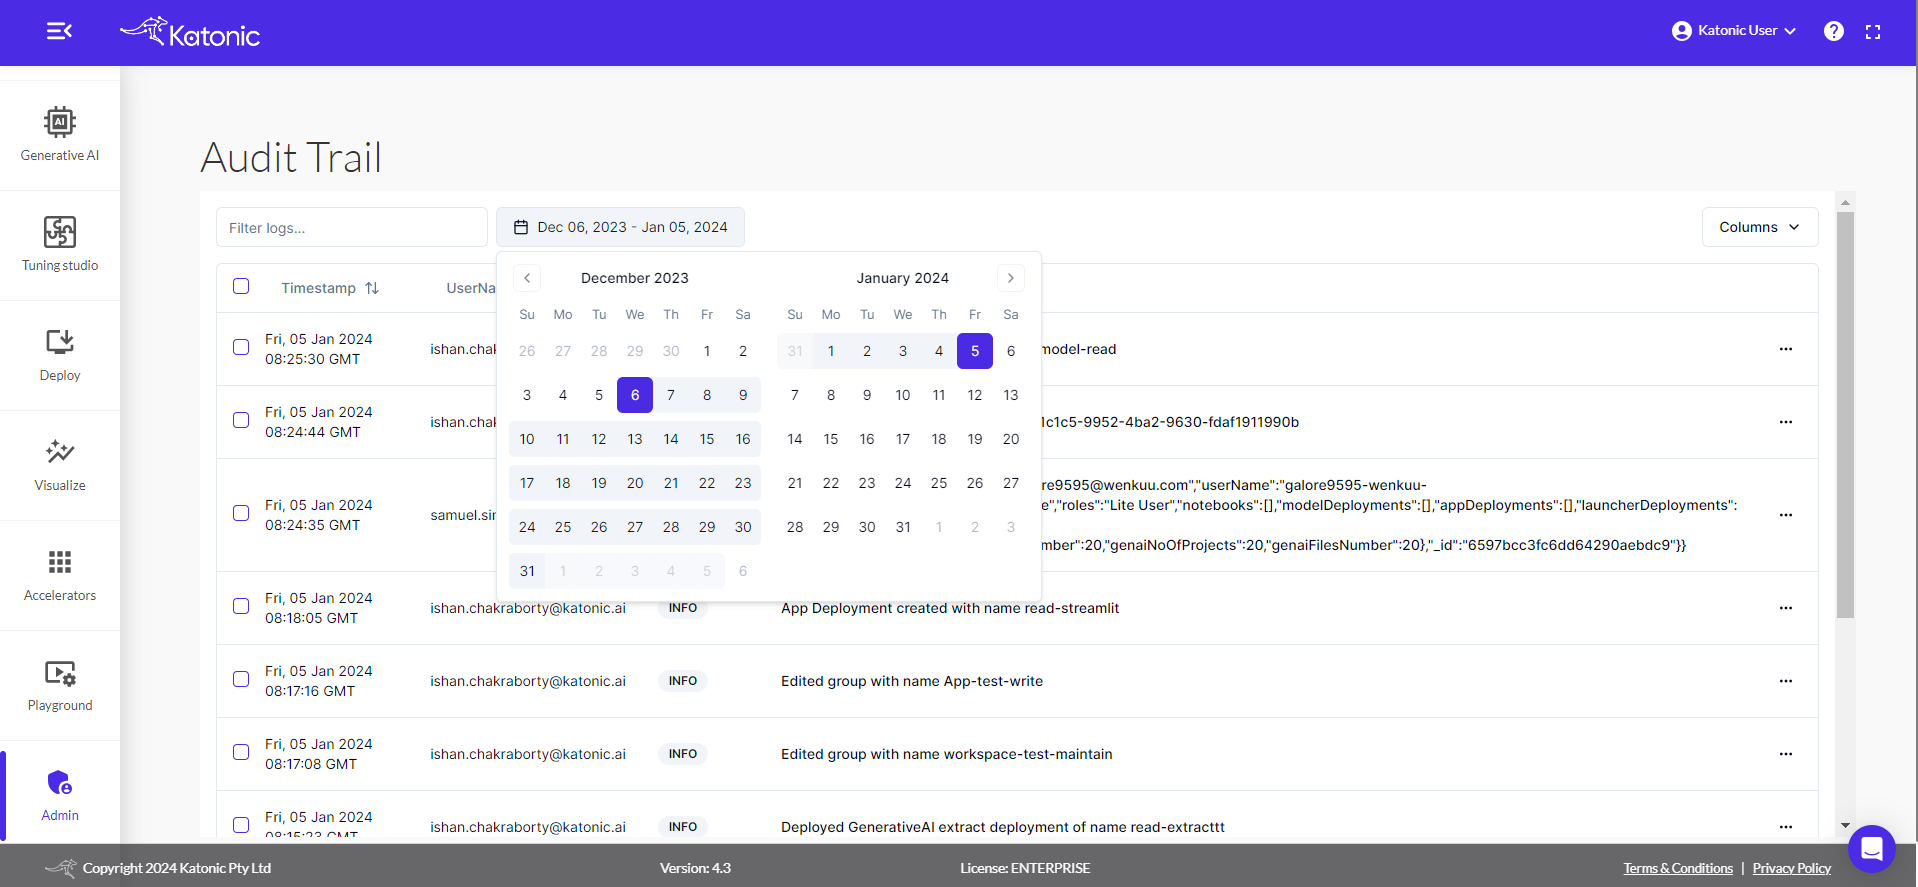
Beside it, you can find the calender for marking the dates between which you want the logs to be displayed.
You can click on it and mark the two dates in the dropdown calender.
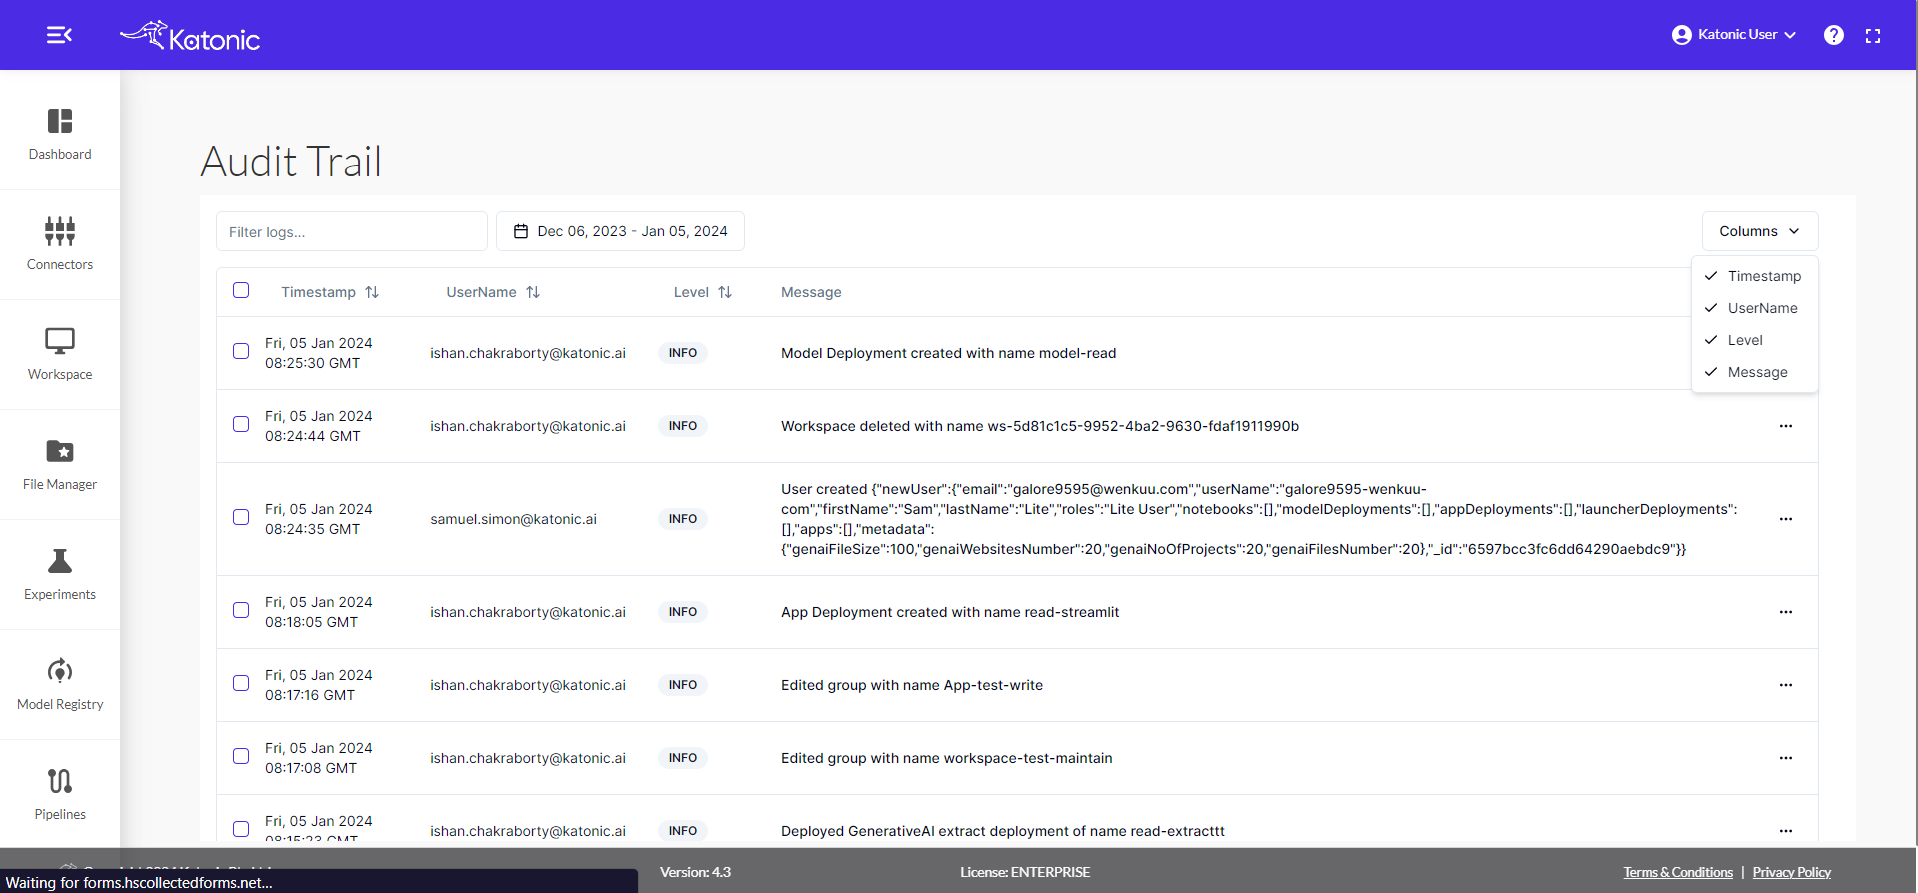
On the extreme right, you will find the Columns button. By clicking on it, you will find a drop-down with four options: Timestamp, UserName, Level and Message. You can select the column name according to which you want the logs to be displayed.
On the bottom of the logs table, you will find two buttons for navigation,i.e, Previous and Next and one button for downloading the logs table in JSON format,i.e, Export